Some of the most sophisticated quant funds on earth make money from a deceptively simple idea: prices that stray too far from their average tend to snap back. That’s the mean reversion strategy. Stripped of the PhD-level math, it’s something a retail trader can understand in an afternoon and automate in a weekend. You’re not predicting the future. You’re betting that markets overreact, then correct.
This guide simplifies what hedge funds do into rules you can actually use. You’ll get the core logic, the exact entry and exit signals, and a worked example. Then an honest look at where the strategy works — and where it quietly breaks.
What this guide covers
- The core idea: buy fear, sell greed
- How the mean reversion strategy works
- A worked example with real rules
- How hedge funds actually use it
- Where the mean reversion strategy works best
- Where it breaks down
- Mean reversion vs momentum
- Risk management for the mean reversion strategy
- Mean reversion indicators compared
- Building a simple mean reversion bot
- FAQ
- Key takeaways
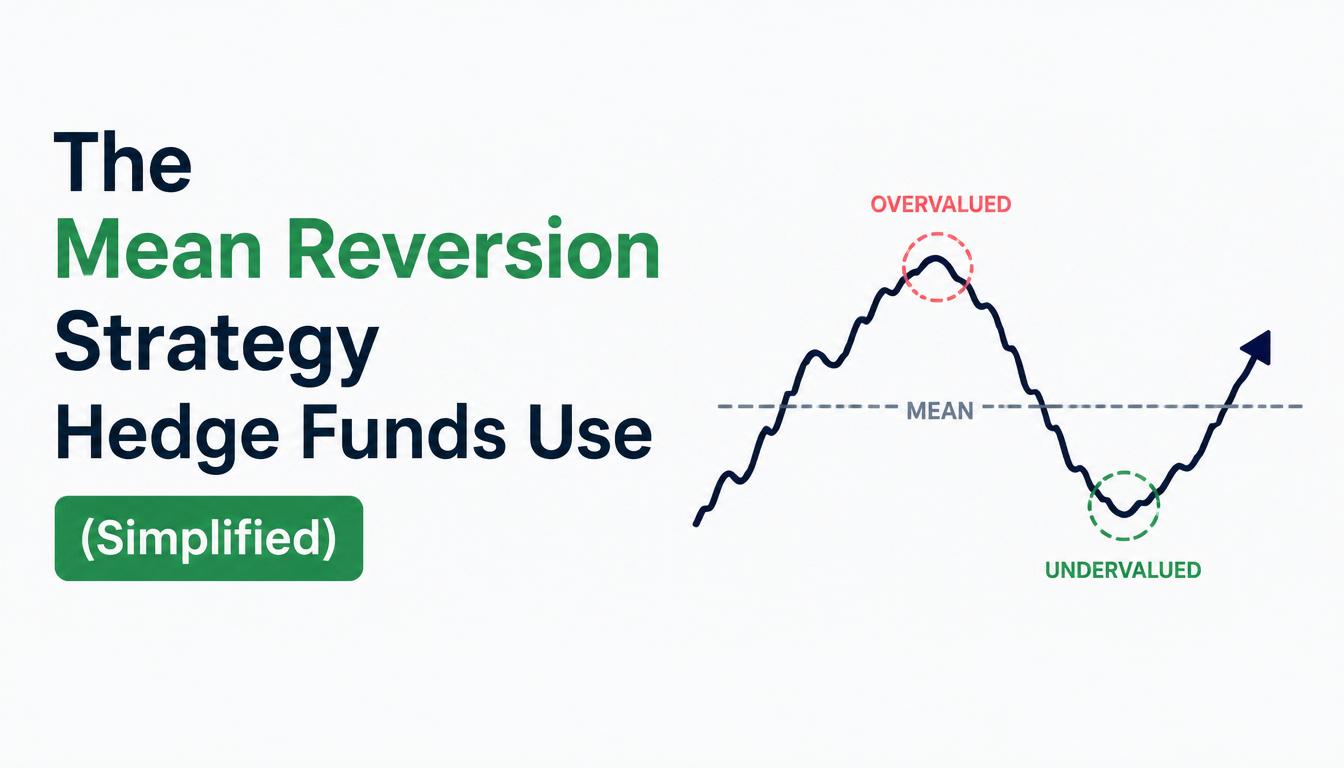
The core idea: buy fear, sell greed
Mean reversion rests on a single financial theory: asset prices don’t trend endlessly in one direction. They tend to return — to “revert” — to a historical average over time. When a price spikes far above its norm, the strategy expects it to fall back. When it crashes far below, it expects a bounce.
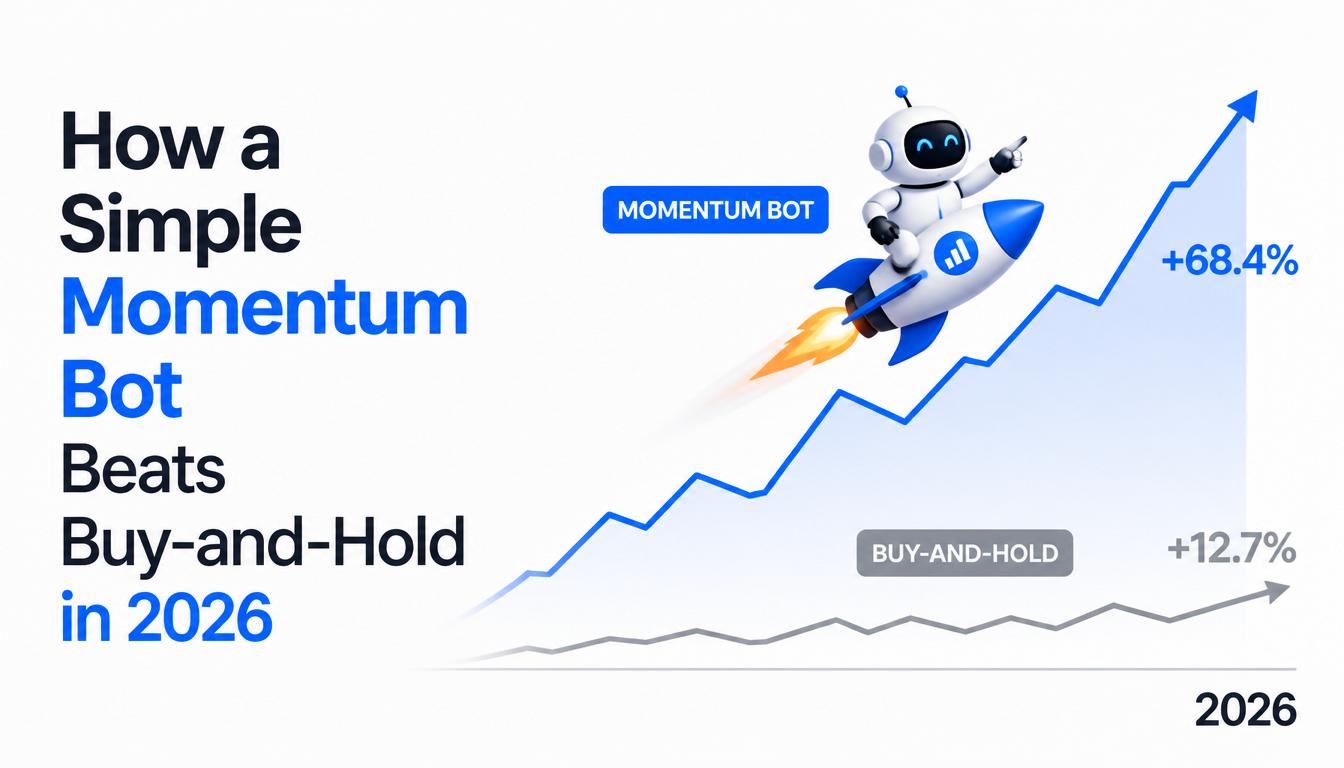
In plain terms, you buy weakness and sell strength. It’s the opposite of momentum, which buys strength and sells weakness. Where momentum assumes a move will continue, the mean reversion strategy assumes an extreme move has overshot and will correct. Both can be true — just in different market conditions.

How the mean reversion strategy works
The strategy needs two things: a definition of “the average,” and a measure of how far price has strayed from it. Traders typically use one of three tools:
- Bollinger Bands — bands set a couple of standard deviations above and below a moving average. Price touching the lower band signals “too cheap.”
- RSI (Relative Strength Index) — a momentum oscillator; readings below 30 flag oversold, above 70 flag overbought.
- Statistical z-scores — a precise measure of how many standard deviations price sits from its mean.
When the measure hits an extreme, the strategy takes the contrarian side and waits for the snap back toward the average. That’s the whole engine.
A worked example with real rules
Let’s turn the theory into a concrete, testable system on a stock.
- Entry signal: buy when the price closes below the lower Bollinger Band, or when RSI drops below 30 (oversold).
- Exit signal: sell when the price reverts to its moving average, or when RSI climbs back above 50.
Imagine a quality stock that drops sharply on a market-wide scare, pushing RSI down to 25 and price below the lower band. The bot buys. Over the next week, panic fades and buyers return. Price drifts back to its 20-day average, RSI recovers past 50, and the bot sells into the rebound. You captured the overreaction’s correction without predicting a single headline.
As QuantifiedStrategies notes, these simple band- and RSI-based rules are exactly the kind that backtest well on equities.
How hedge funds actually use it
The retail version above is one trade on one stock. Hedge funds run the same logic at vastly larger scale — and that scale is the difference.
Mean reversion is a core component of statistical arbitrage. Quant funds run factor analysis, regression, and machine-learning models to spot tiny pricing inefficiencies across dozens or hundreds of assets at once. They take many small mean-reverting bets simultaneously, diversifying away single-name risk. There’s even a structural tailwind. Large funds operate under mandates that force them to rebalance, often against the prevailing trend — a steady source of the reversion that nimble traders can anticipate.
You won’t replicate a fund’s infrastructure. But the underlying bet — extremes correct — is identical, and on a single liquid stock it’s well within reach.
Where the mean reversion strategy works best
Matching the strategy to the right market is everything.
- Stocks and ETFs — the natural home. Equities mean-revert reliably, especially large, liquid names after market-wide overreactions.
- Range-bound conditions — when price oscillates around a stable average rather than trending, reversion signals are cleanest.
- High-liquidity assets — tight spreads make the small, frequent edges worth capturing.
This is why the strategy is a staple of equity stat-arb desks and a sensible first contrarian system for retail stock traders.
Where it breaks down
Now the honesty. The mean reversion strategy has one catastrophic failure mode: a strong, sustained trend.
Say a price keeps falling for a real reason — a collapsing company, a regime shift. “Buying the dip” then means catching a falling knife, again and again, as your “cheap” entry gets cheaper. The strategy assumes the move was an overreaction. When it’s actually a justified repricing, reversion never comes. This is also why it works poorly on forex, which tends to trend more than it reverts. The fix is non-negotiable: a stop-loss to cap the trade when reversion fails, plus regime awareness to stand down in strong trends.
Mean reversion vs momentum
The clearest way to understand mean reversion is against its opposite. A mean reversion strategy buys weakness and sells strength, betting an extreme move reverses. A momentum strategy does the reverse — it buys strength and sells weakness, betting the move continues.
That single difference dictates where each one wins. Mean reversion thrives in range-bound, choppy markets, where price keeps oscillating around a stable average. Momentum thrives in strong, persistent trends, the exact conditions that destroy a reversion bot. Run the wrong one in the wrong regime and you’ll lose steadily.
This is why serious traders rarely pick just one. As our roundup of algo trading strategies that work explains, the most robust modern systems detect the market regime and switch behavior accordingly — leaning on reversion when the market ranges and stepping aside when it trends. Knowing both strategies turns a one-trick bot into an adaptable one.
Risk management for the mean reversion strategy
Because the mean reversion strategy deliberately buys falling assets, risk control isn’t optional — it’s the whole game. A few rules keep a contrarian bet from becoming a catastrophe.
- Always use a stop-loss. Place it beyond the point where “overreaction” stops being a credible explanation. If price blows past it, the move was real, and you want out.
- Size positions small. You may add to a losing position as it falls; that only works if each entry is modest enough to survive being wrong.
- Add a regime filter. Check a long-term trend indicator first. If the asset is in a strong downtrend, stand aside — reversion signals are traps there.
- Cap total exposure. Several “cheap” assets can all keep falling together in a market-wide rout. Limit how much capital the strategy can deploy at once.
Get these right and a failed trade is a small, planned loss. Get them wrong and a single falling knife can undo months of patient gains.
Mean reversion indicators compared
The three tools that flag an overextended price aren’t interchangeable. Each has a personality worth knowing before you build.
Bollinger Bands wrap a moving average in two bands set a couple of standard deviations away. Price tagging the lower band means it’s stretched unusually far below its recent norm. The bands adapt to volatility on their own — widening in wild markets and tightening in calm ones — which makes them intuitive and self-adjusting. The downside is that in a strong trend, price can “walk the band” for a long time, firing signal after signal that never reverts.
RSI measures the speed and size of recent moves on a 0–100 scale. Readings below 30 flag oversold, above 70 overbought. It’s simple and widely understood. But it’s a blunt instrument: a stock can stay oversold for weeks in a genuine decline, so RSI alone catches plenty of falling knives.
Z-scores are the quant’s choice. A z-score states exactly how many standard deviations price sits from its mean. That gives a precise, comparable measure across different assets, which is why statistical-arbitrage desks favor it. The catch is that it assumes well-behaved data, and real markets often aren’t.
In practice, many traders combine two. They use a z-score or Bollinger Band to define “how stretched,” then RSI to confirm momentum is actually fading. No single indicator is a silver bullet. The mean reversion strategy works best when the signal is corroborated and paired with the stop-loss discipline covered above.
Building a simple mean reversion bot
You can automate a basic version with Python in a weekend:
- Pick a liquid stock or ETF with a history of ranging behavior.
- Compute a 20-day moving average and Bollinger Bands (or RSI) with pandas.
- Code the entry/exit rules from the example above.
- Add a stop-loss outside the band to survive failed reversions.
- Backtest with fees and slippage, then paper trade before going live.
Resist over-tuning the band widths and RSI thresholds to a single backtest — that’s overfitting, and it’s how a clean idea turns fragile. None of this demands advanced math; it just rewards clean data and disciplined, consistent rules.
FAQ
Is the mean reversion strategy profitable? It can be, particularly on liquid stocks in range-bound conditions. Profitability depends on disciplined exits and avoiding strong trends, where the strategy fails.
What indicators does mean reversion use? Most commonly Bollinger Bands, RSI (oversold below 30, overbought above 70), and statistical z-scores to measure how far price has strayed from its average.
Why do hedge funds use mean reversion? It’s central to statistical arbitrage. Funds take many small reverting bets across many assets, diversifying risk, and benefit from forced rebalancing that often pushes against the trend.
What markets does mean reversion work in? Best in stocks and ETFs, especially range-bound ones. It works poorly in trending markets like forex, which revert less and trend more.
What’s the biggest risk? Catching a falling knife — buying a “cheap” asset that keeps falling because the move was justified, not an overreaction. A stop-loss is essential.
Mean reversion vs momentum — which is better? Neither universally. Mean reversion wins in range-bound markets; momentum wins in trending ones. The strongest setups detect the market regime and switch between them rather than committing to one.
How long should I hold a mean reversion trade? Until price reverts to its average or your exit signal fires — RSI back above 50, for instance — or until your stop-loss is hit. These trades are typically short, lasting days to a couple of weeks, not months.
Can I use mean reversion on crypto? Yes, but carefully. Large-cap coins do revert after sharp overreactions, yet crypto also produces violent, sustained trends that punish contrarian bets. Use a tighter stop and a regime filter, stick to liquid coins, and keep size small while you learn how it behaves.
Key takeaways
- The mean reversion strategy buys fear and sells greed, betting extreme moves snap back to an average.
- It uses Bollinger Bands, RSI, or z-scores to flag overextended prices, with clear entry and exit rules.
- Hedge funds run it at scale as the core of statistical-arbitrage strategies.
- It works best on liquid, range-bound stocks and poorly in strong trends or forex.
- A stop-loss is mandatory — its fatal flaw is catching a falling knife when reversion never comes.
Want to build this bot the right way? Our free Algo Trading Starter Kit includes a Python mean-reversion template with Bollinger Bands and RSI, a backtesting checklist, and our broker comparison. Download it free → and trade the snapback with rules, not guesses.